

Use your WHITS: Applying the Weighted HITS Algorithm in analyzing the world trade network
This is the final project for our Network Science class held from January 2021 to June 2021. This was created alongside my Term 4 learning teammates: Adriane Amorado and Joanna Quinto. For this final project, we were tasked to apply network tools and extract insights from our chosen dataset.
Motivation of the study
Studying the world trade network (WTN) has played a significant role in international trade analysis and in uncovering patterns and structures of economic systems across countries. In this study, we investigated trends and patterns of international trade and tried to identify which countries are considered as key players by looking at the whole network and in specific product categories, and how they affect each other in the WTN.
In our analysis, we explored the use of the Weighted Hyperlink-Induced Topic Search (WHITS) Algorithm. Our findings in this study build on two previous studies: 1) Deguchi, Takahashi, Takayasu, & Takayasu (2014) which first applied the WHITS algorithm but on the United Nations Commodity Trade Statistics Database (Comtrade); and 2) De Benedictis et al (2014) which conducted an exhaustive network analysis on the 1995-2010 Base pour l’Analyse du Commerce International - Centre d’Etudes Prospectives d’Informations Internationales (BACI- CEPII) World Trade dataset, as well as conducted a product network analysis.
About the data
We used the 2012-2019 BACI-CEPII World Trade dataset, a dataset worth 2.75 GB in size. Columns available to us are the year, the 6-digit HS code for product category, exporter, importer, and the value of the trade flow, similar to the Comtrade dataset.
Methodology
- Data collection: Data was readily available and downloaded from the BACI-CEPII website.
- Data pre-processing: Minimal data pre-processing was conducted, as the dataset has already resolved null values, unlike the Comtrade dataset. We merely added columns to match the ISO 3-digit code to the country name (for ease of analysis), as well as added the product category name for the trade flow. Langitude and longitude data were added to the dataset to generate maps.
- Exploratory data analysis (EDA): To begin analysis of the network, we created a directed network using import and export countries as nodes and trade flows as edges. Weights were assigned to each edge using the amount of trade (in USD) for that specific trade flow.
- Apply the WHITS algorithm: To identify countries that have the most influence as importers and exporters, we applied a weighted Hyperlink-Induced Topic Search (WHITS) and compared the results using a simple HITS algorithm and by simply getting the node with the highest average degree.
- Further EDA on product networks: Similar to De Benedictis et al (2014), we conducted an EDA on specific product networks, particularly the banana industry, the footwear industry, and our choice: the coconut industry, as the Philippines is a top exporter for this product.
Insights
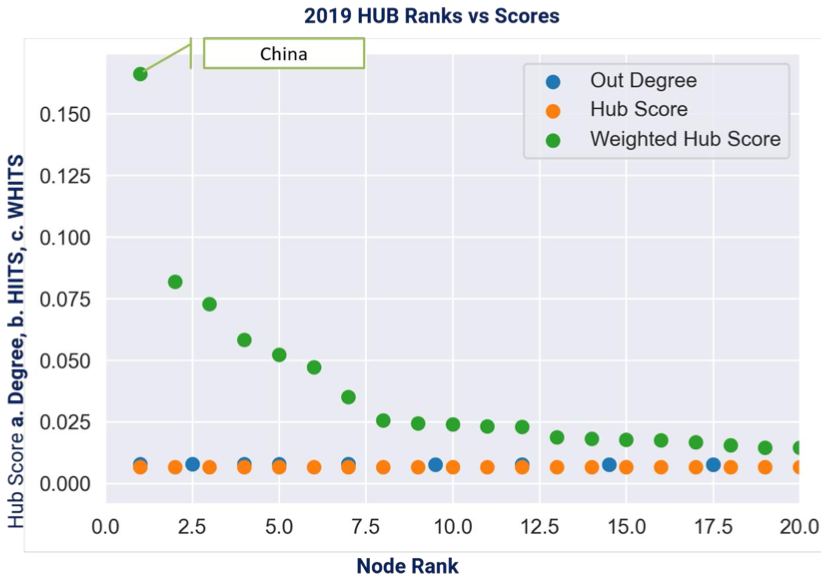

- As shown above, we were able to establish that top hubs and authorities differ based on the algorithm used. The list of countries would vastly be different compared to using a HITS score or even just the degree of the node.
- We observed a linear relationship between a country’s hub and authority score, which means that top hubs are very much likely to become top authorities also.
- Using 2019 data, China and Mexico appear to be the top hubs overall, while the USA and Hong Kong are the leading authorities.
- We also explored who the key players are for the banana, coconut, and footwear product categories. We found that Ecuador-France, India-Netherlands, and China-France are the top hub-authority pairs for each product category, respectively.