

90 Miles Inside Chicago: Understanding Taxi and Ridesharing Segments of Chicago
This is a final project for our Data Mining and Wrangling class held from May 2020 to August 2020. This was created alongside my Term 2 learning teammates: Ethan Casin, DK Go, Karl Navarro, and Daryll Tumambing. For this project, we were tasked to:
1. collect data via an API or by web scraping 2. conduct vector representation, feature selection and/or dimensionality reduction, and clustering
The findings of our final project were then presented to the public.
Research question
Uber, Lyft, and Sidecar, generally known as ridesharing companies, are recognized in the City of Chicago as Transportation Network Providers (TNP). With the rapidly changing industry for both taxis and TNPs, we wish to analyze the various factors that can affect their revenue stream. What are the various customer segments faced by Chicago taxi and ride-hailing drivers? Aside from fare pricing, what else should drivers look into? For those entering the market as a driver for either industry, what can they expect? Are there certain locations or routes to focus on to maximize income? What is the best time to operate?
About the data
We used the City of Chicago’s Open Data API on Transportation Network Providers (TNP) and taxi transactions. On this project, we limited it to only 2019 data. Both datasets contain approximately 100 million rows of data pertaining to trip transactions for both transportation type happening in the city. It includes information on a trip’s pick-up and drop-off location, approximated time, fare, tips, distance and duration. See columns used from this dataset below.
Methodology
- Scraping. Data was first scraped from the Chicago data portal for both the taxi and TNP datasets. Because of the huge amount of data for each dataset and the limitation by the endpoints of 5000 records per request, they were iteratively gathered from the API endpoints and written into a database.
- Clean-up and Sampling. The datasets are too large to be processed so the datasets were randomly sampled to a more manageable size. During the process, some clean-up steps were done and imputation of null values. The datasets were also evenly sampled later for equal parts taxi and TNP datapoints.
- Dimentionality Reduction. Using Principal Component Analysis, the number of features used for clustering were reduced.
- Clustering. We applied \(k\)-medians clustering on the reduced dimensions and chose an appropriate number of clusters based on inertia and the Calinski-Harabasz score.
- Exploratory Data Analysis. Each of the clusters were then studied to bring out insights on the segments and behavior of the passengers.
Insights
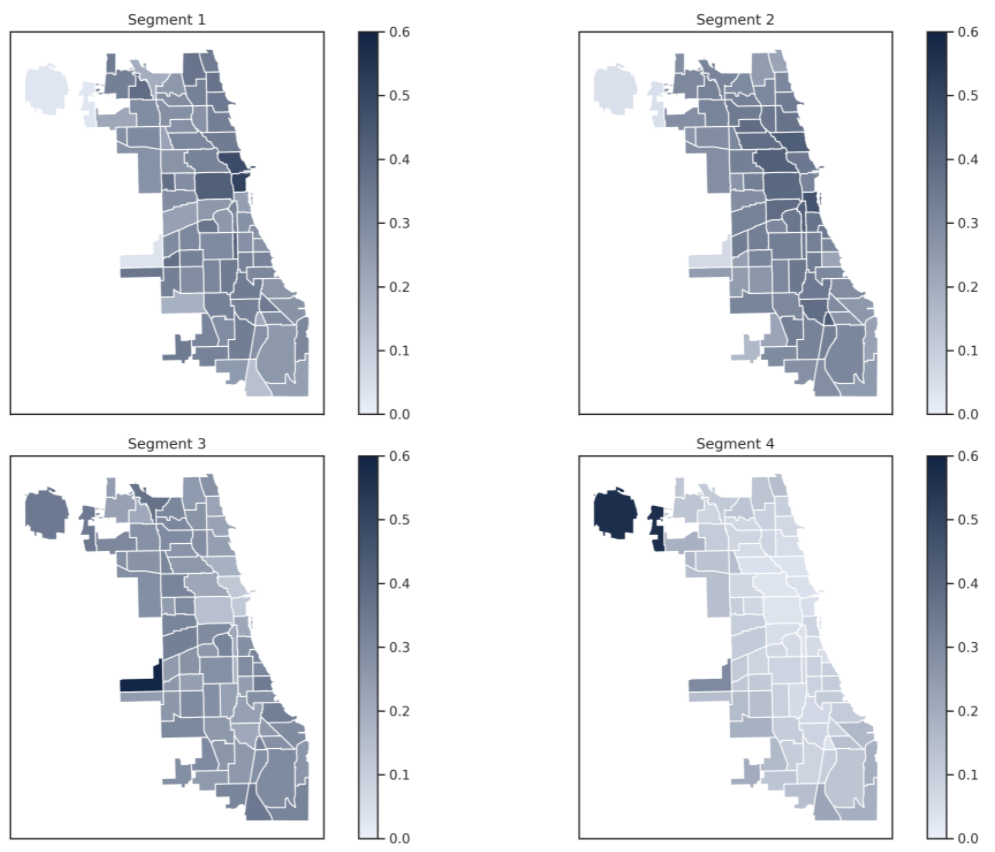
Heatmap of customer segments’ pickup locations.
- By conducting singular value decomposition (SVD) as a dimensionality reduction method and then k-medians as a clustering method, we found a total of four clusters which we each identified as customer segments. The clustering created customer segments based on trip duration and distance.
- Segment 1 has the lowest paid fare and tip due to having the shortest trip distance and duration. It is also composed mainly of taxis and is traveling mostly within Near North Side.
- Segment 2, on the other hand, is situated near South Side with the most frequent route being between Near North Side and the Loop.
- Coming from Garfield Ridge, which is a small community, is Segment 3 which has the highest ratio of TNPs.
- And finally, we have Segment 4, which has the highest paid fare and tip with the longest trip distance and duration. However, the travel pattern observed for this segment is quite erratic which made us conclude that customers from this segment are visitors of the city unlike other segments which are composed of locals.
For a quick summary, here’s a table.
| Segment 1 | Segment 2 | Segment 3 | Segment 4 | |
|---|---|---|---|---|
| Fare | Lowest amount paid, shortest duration and distance | 3rd place in highest amount paid, 3rd place in trip duration and distance | 2nd place in highest amount paid, 2nd place in trip duration and distance | Highest amount paid, longest duration and distance |
| Transport Type | Taxi | Ridesharing | ||
| Time | Erratic | |||
| Frequent pickup community area | Near North Side / The Loop | Near South Side | Garfield Ridge | O’Hare |
| Route | Within Near North Side | Near North Side to The Loop | O’Hare to Near North Side | O’Hare to Near North Side |
We find that the clustering brough about customer segments with varying travel behaviors, in terms of the basic trip features, their travel patterns, and routes.